# HiSub: Generate Hiplot Native Plugin from a Structured R Script
Hiplot plugin (self-contained applications generated by Shiny or other techniques are not included) uses JSON to communicate backend with the front end, it is not easy to code and maintain both R script and JSON files at the same time. To happier make Hiplot plugin, we develop HiSub and let it help us convert a structured R script with special comments to a Hiplot plugin. If you have developed a tool with a non-R program, you can also wrap it in an R script. So in general, all data analysis/visualization programs can be translated as a Hiplot native plugin.
# Hiplot plugin tree
A Hiplot plugin is a combination of an R script and three JSON files.
plot.R: where the core data analysis/visualization implemented.ui.json: UI controls of the plugin.data.json: default setting .meta.json: plugin metadata including author, emails, etc.
To tell the users how to use the plugin, you can also include two Markdown files to describe the detail of plugin, notes.
README.md: detail usage of the plugin in English.README.zh_cn.md: detail usage of the plugin in Chinese.
PS. You can also provide one of the files and request the Hiplot maintainers to translate it to another.
# Installation
To use HiSub, you have to install R package {hiplotlib} (opens new window) with:
remotes::install_github("hiplot/hiplotlib")
# Unix-like system
If you are using Unix-like system (i.e., MacOS or Linux), you can run hiplotlib::deploy() to deploy
the script to PATH variable, then you can run HiSub with hisub.
R console:
library(hiplotlib)
deploy()
# Linking hisub command
# Linking hicli command
# Done
# Now you shall run hisub and hicli from anywhere.
Terminal:
$ hisub
Using library: /Users/wsx/Library/R
HiSub version 0.4
Copyright (c) 2021 Hiplot (https://hiplot.cn/)
========================
Checking dependencies...
Loading required package: pacman
Done
Checking input...
No operations detected.
Usage:
        `hisub template` to generate a template.
        `hisub source.R [...] [outdir]` to convert R script to Hiplot plugin.

Details see <https://github.com/hiplot/hiplotlib>
# Windows system
If you are using Windows system, you can locate the hisub.R in R console with:
system.file(package = "hiplotlib")
# [1] "D:/Rlib/hiplotlib"
Then you can run HiSub with the following command in PowerShell/CMD:
$ Rscript D:/Rlib/hiplotlib/hisub.R
You will get similar prompt message like Unix-like system.
# HiSub usage
# Step 1: generate template
First you should prepare an R script named source.R in terminal with:
In Windows, you should modify the
hisubtoRscript D:/Rlib/hiplotlib/hisub.R, whereD:/Rlib/hiplotlibshould be changed to result ofsystem.file(package = "hiplotlib")on your machine.
$ hisub template
Using library: /Users/wsx/Library/R
HiSub version 0.4
Copyright (c) 2021 Hiplot (https://hiplot.cn/)
========================
Checking dependencies...
Loading required package: pacman
Done
Checking input...
'template' command detected. Generating template 'source.R'.
Done
You will find a source.R file has been created in your directory.
$ ls
source.R
# RStudio snippet
If you're using RStudio, you can also use the RStudio snippet to generate the template,
run the following code to add hiplugin snippet:
addPackageSnippets()
Following the instruction poping up and restart the rstudio.
Then open a new file, you can type hiplugin (You can use
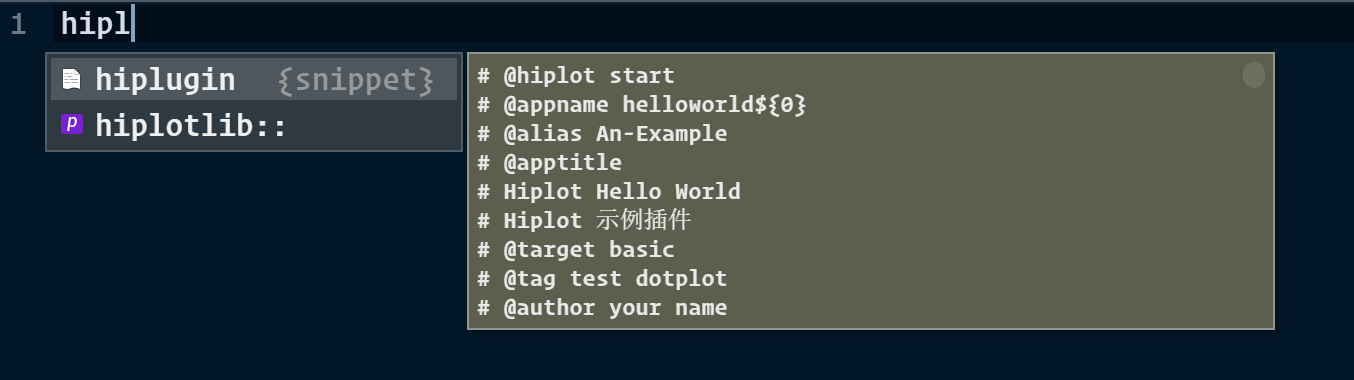
# VSCode snippet
If you're prefer to using VSCode, we provide a snippet in r.json, you can copy its content to VSCode R snippet.
If you have'nt use VSCode R snippet before, you can type
<CTRL>+<Shift>+Pto call the search panel and typeConfigure User Snippetand selectRto open ar.jsonfile.
# Step 2: implement the computation/visualization
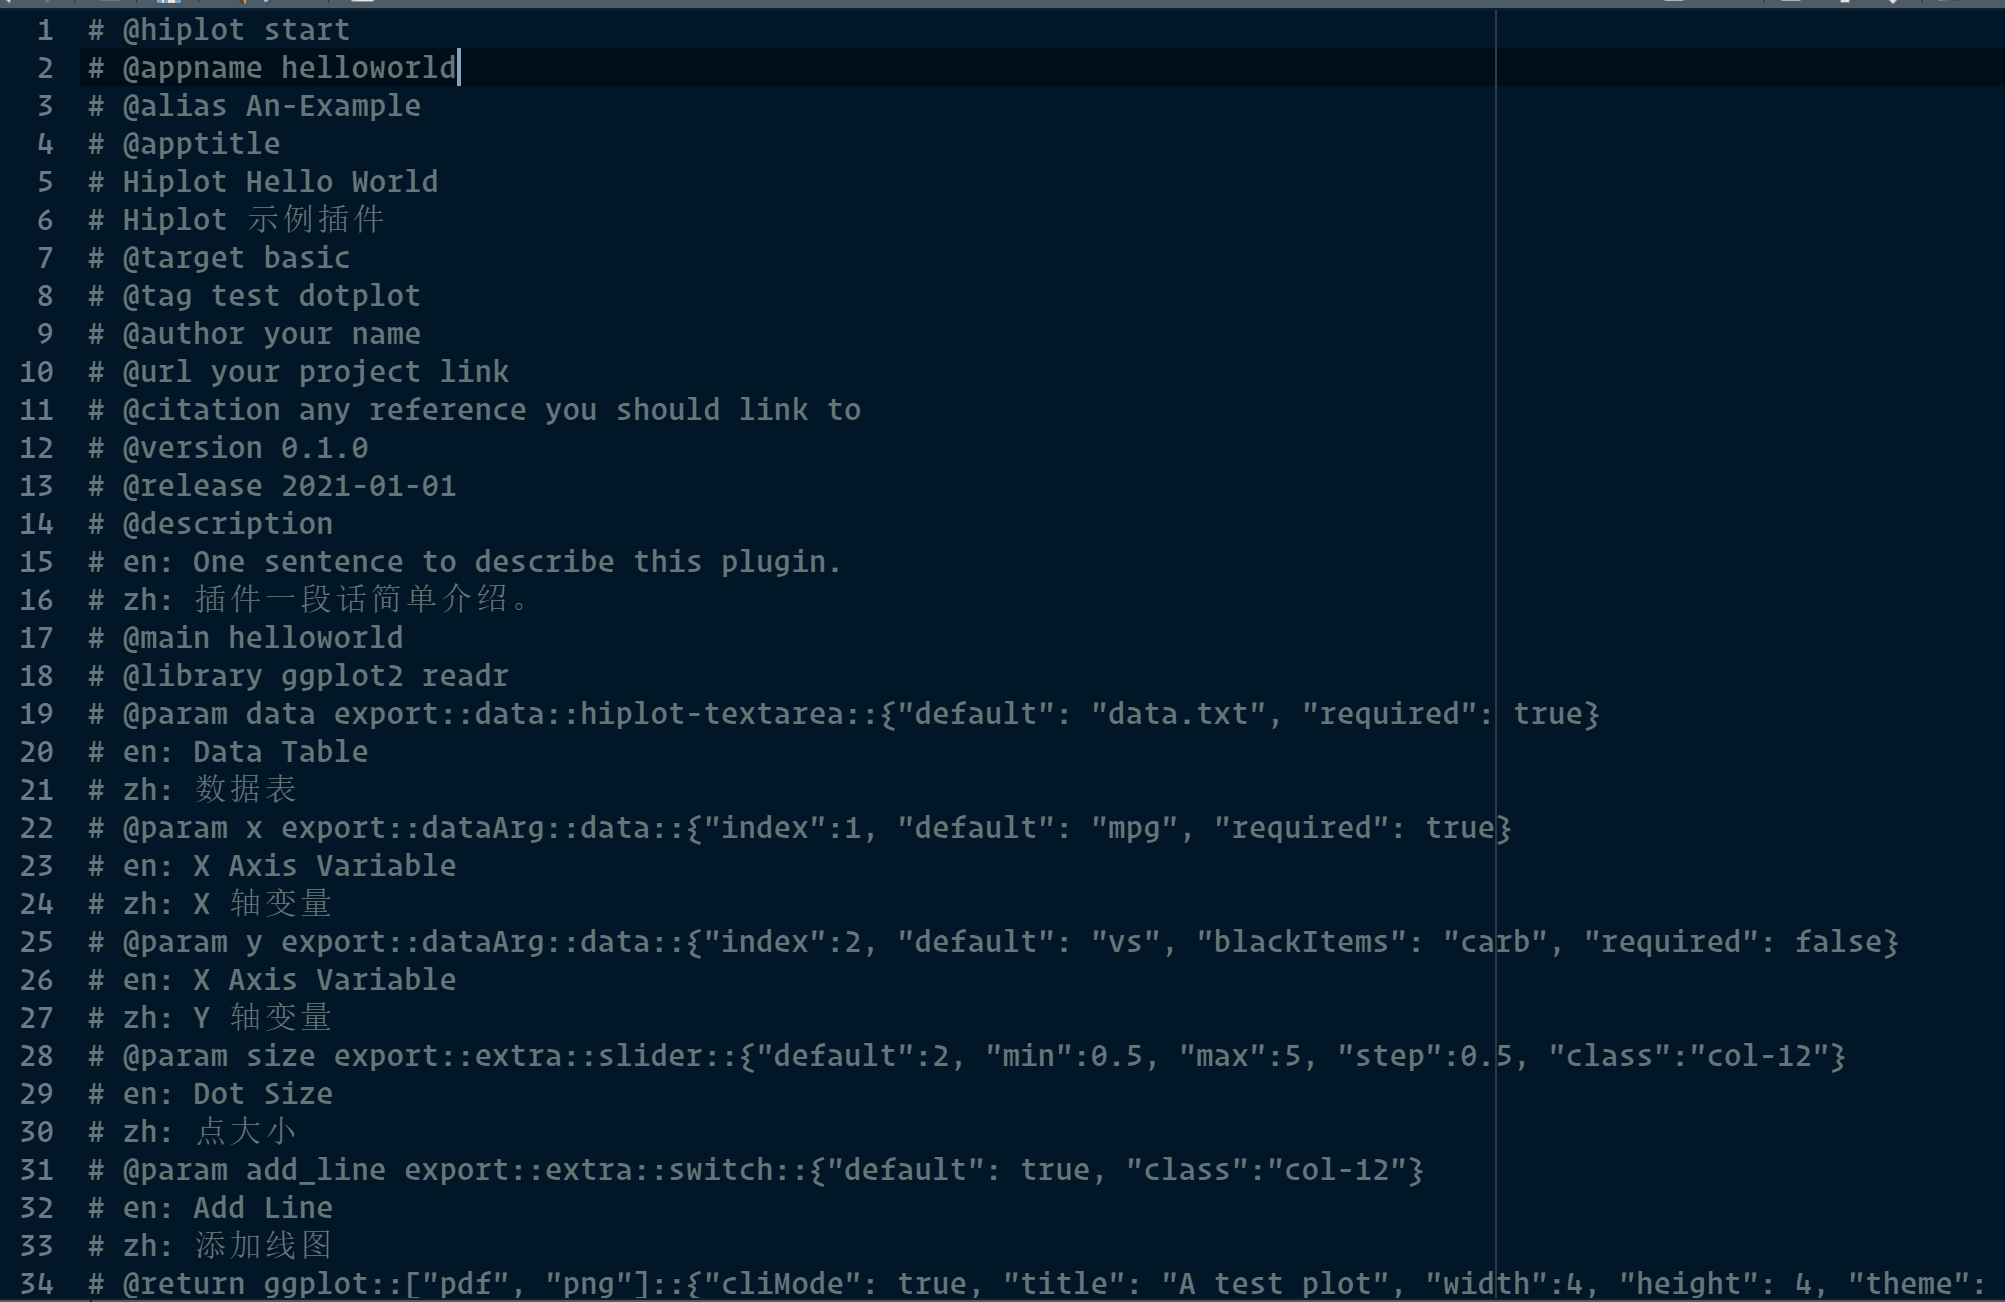
Now you open the source.R with your favorite editor (RStudio/VSCode/Vim), you will find a helloworld Hiplot plugin has been generated for you, this template plugin shows the core concept of Hisub and most common setting.
$ cat source.R
# @hiplot start
# @appname helloworld
# @alias An-Example
# @apptitle
# Hiplot Hello World
# Hiplot 示例插件
# @target basic
# @tag test dotplot
# @author your name
# @url your project link
# @citation any reference you should link to
# @version 0.1.0
# @release 2021-01-01
# @description
# en: One sentence to describe this plugin.
# zh: 插件一段话简单介绍。
# @main helloworld
# @library ggplot2 readr
# @param data export::data::hiplot-textarea::{"default": "data.txt", "required": true}
# en: Data Table
# zh: 数据表
# @param x export::dataArg::data::{"index":1, "default": "mpg", "required": true}
# en: X Axis Variable
# zh: X 轴变量
# @param y export::dataArg::data::{"index":2, "default": "vs", "blackItems": "carb", "required": false}
# en: X Axis Variable
# zh: Y 轴变量
# @param size export::extra::slider::{"default":2, "min":0.5, "max":5, "step":0.5, "class":"col-12"}
# en: Dot Size
# zh: 点大小
# @param add_line export::extra::switch::{"default": true, "class":"col-12"}
# en: Add Line
# zh: 添加线图
# @return ggplot::["pdf", "png"]::{"cliMode": true, "title": "A test plot", "width":4, "height": 4, "theme": "theme_bw"}
# @data
# # You can write the code to generate the example data
# # "data.txt" described in parameter data, or you can
# # omit this tag and submit prepared data files.
# # File size <100Kb is recommended.
# # 此处可以编写生成示例数据(建议小于 100Kb)的代码
# # 示例数据文件需要跟数据表格参数对应起来
# # 或者忽略该标签,提交已经准备好的示例数据
# library(readr)
# data("mtcars")
# write_tsv(mtcars, "data.txt")
# @hiplot end

library(ggplot2)
helloworld <- function(data, x, y, size = 2, add_line = TRUE) {
  if (y == "") stop("y must be provided!")
  p <- ggplot(data, aes_string(x = x, y = y))
  p <- p + geom_point(size = size)
  if (add_line) {
    p <- p + geom_line()
  }
  # Here export a ggplot object
  # Or the whole main function generate a basic R plot
  return(p)
}
If you only write English, you can repeat English in the Chinese description part.
Check Hiplot tag list section for more description about supported Hiplot tags.
We can divide the script contents into 2 parts:
- The comment PART describe the metadata of this plugin and how the parameters map to a web widget (e.g.,
select) and their default values. - The code PART describe how to generate the result plot and we should include the core plotting code in a function.
NOTE: we use tag
@xxxto recognize the useful information. HiSub will only parse the comments between@hiplot startand@hiplot end. And only the parameters withexport::will be parsed.
With the R script, we can generate the Hiplot plugin with command:
$ hisub source.R helloword
Using library: /Users/wsx/Library/R
HiSub version 0.4
Copyright (c) 2021 Hiplot (https://hiplot.cn/)
========================
Checking dependencies...
Loading required package: pacman
Done
Checking input...
Done
Preprocessing R script source.R
Done
Parsing Hiplot tags...
Generating example data file...
Done
Generating plugin files...
        Set example data
         data rows: 32
         esize: 1.2509765625
  - meta.json
  - data.json
  - ui.json
  - plot.R
Styling  1  files:
 helloword/plot.R ℹ
────────────────────────────────────────
Status  Count   Legend
✔       0       File unchanged.
ℹ       1       File changed.
✖       0       Styling threw an error.
────────────────────────────────────────
Please review the changes carefully!
ALL operations done. Check output directory for generated plugin.
HiSub accept as many as parameters you can put, but only the first will be treated as the R script (here is source.R) to parse.
Others parameters:
- The last argument should be a directory path for the plugin, typically it has the same name as your plugin name.
- Other middle arguments will be treated as necessary files (like
README.md) and copied to the destination directory (specified by the last argument).
Now you got a helloworld plugin for Hiplot:
$ tree helloword
helloword
├── data.json
├── data.txt
├── meta.json
├── plot.R
└── ui.json

0 directories, 5 files
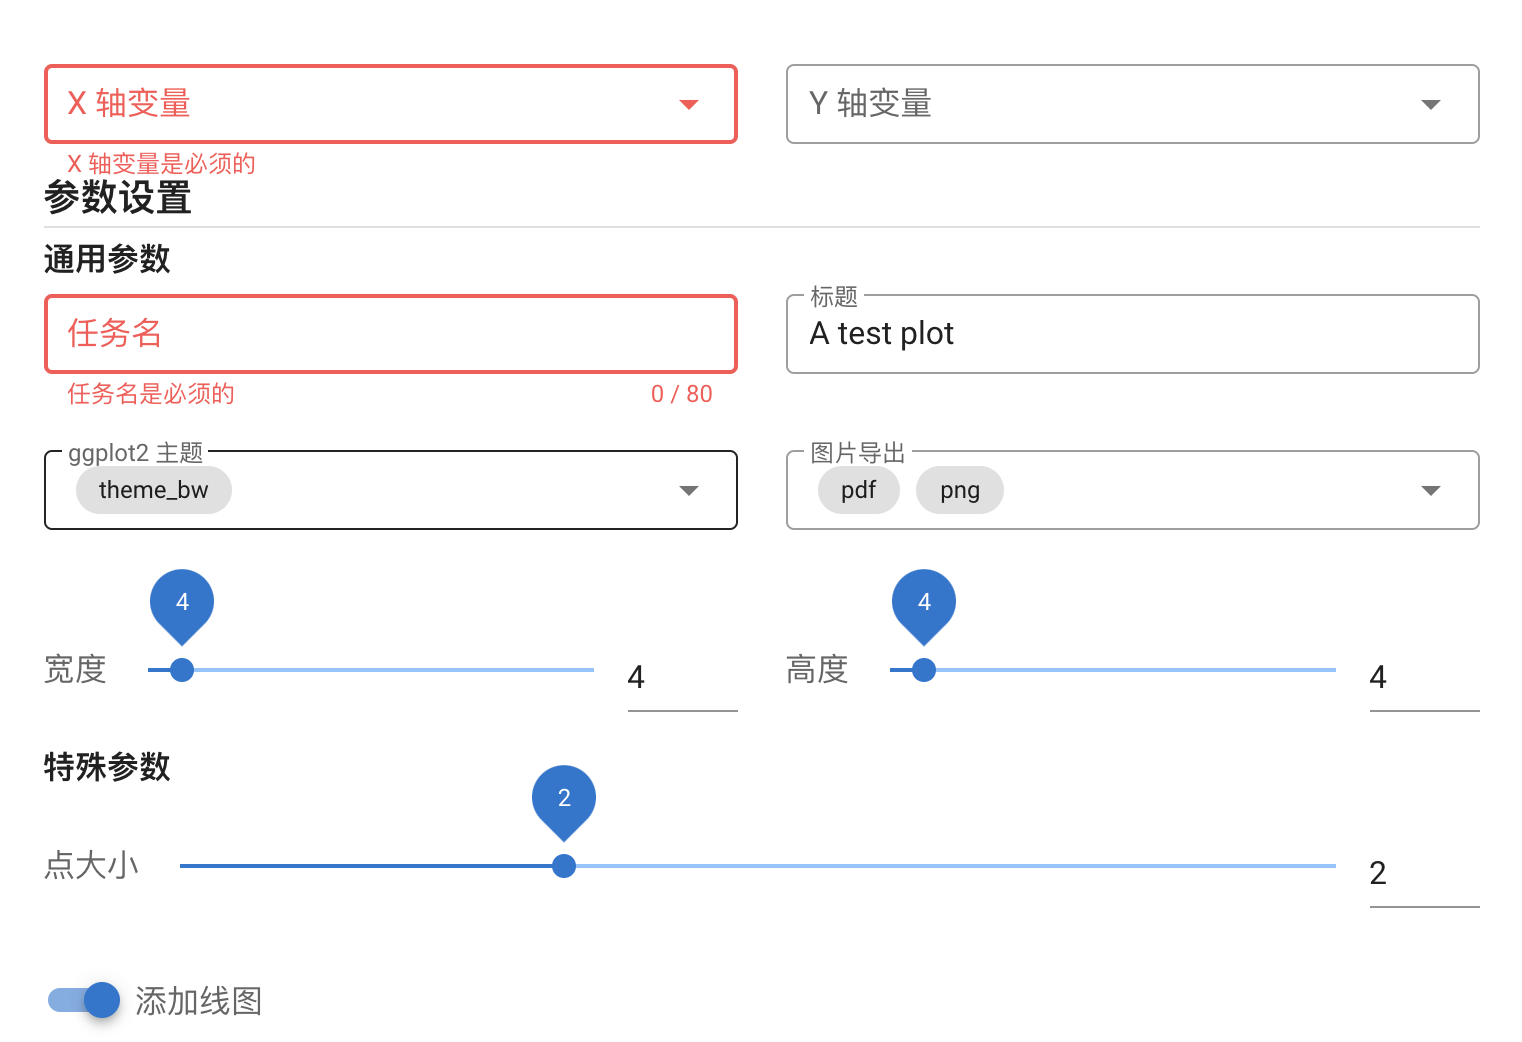
# Step 3: preview the plugin
Then you can submit the generated data.json and ui.json to https://hiplot.cn/developer/plugin-preview (opens new window) (You can also read exmaples provided by this link and see how to set the parameter settings) to see how it works. For our "Hello World", it looks like:
# Step 4 (optional): local test
If you want to test locally to see if your plugin works well, 'hicli' command would help you.
# Use hicli in terminal
$ cd helloword
$ # Check help
$ hicli -h
Using library: /Users/wsx/Library/R
Usage: /usr/local/bin/hicli [options]


Options:
        -i INPUTFILE, --inputFile=INPUTFILE
                input data

        -c CONFFILE, --confFile=CONFFILE
                configuration file

        -o OUTPUTFILEPREFIX, --outputFilePrefix=OUTPUTFILEPREFIX
                prefix of output plots

        -t TOOL, --tool=TOOL
                (e.g. heatmap))

        -m MODULE, --module=MODULE
                module name (e.g. basic)

        -s, --simple
                only loading core packages

        -e, --enableExample
                enable auto load example

        -h, --help
                Show this help message and exit
Run the helloword plugin locally.
$ hicli -i data.txt -c data.json -t helloword -m basic -e -s -o hwtest/helloword

General packages cowplot, patchwork, extrafont, R.utils are loaded.
   mpg cyl disp  hp drat    wt  qsec vs am gear carb
1 21.0   6  160 110 3.90 2.620 16.46  0  1    4    4
2 21.0   6  160 110 3.90 2.875 17.02  0  1    4    4
3 22.8   4  108  93 3.85 2.320 18.61  1  1    4    1
4 21.4   6  258 110 3.08 3.215 19.44  1  0    3    1
5 18.7   8  360 175 3.15 3.440 17.02  0  0    3    2
6 18.1   6  225 105 2.76 3.460 20.22  1  0    3    1
[1] "hwtest/log/core-steps.log"
[1] "hwtest/log/done.log"
[1] ""
-emust be enabled to include and preprocess the example data.
Result tree:
$ tree hwtest
hwtest
├── helloword.Rdata
├── helloword.pdf
├── log
│   ├── core-steps.log
│   ├── done.log
│   ├── read-data.log
│   └── read-params.log
└── task.log

1 directory, 7 files
Also a file task.status.json is available in current directory.
# If you prefer to use R console
library(hiplotlib)
basedir = "/Users/wsx/Documents/GitHub/hiplugin-test/helloword"
opt = list(inputFile = file.path(basedir, "data.txt"),
           confFile = file.path(basedir, "data.json"),
           outputFilePrefix = file.path(basedir, "hwtest/helloword"),
           tool = "helloword",
           module = "basic",
           simple = TRUE,
           enableExample = TRUE,
           help = FALSE)
dir.create(dirname(opt$outputFilePrefix))
dir.create(file.path(dirname(opt$outputFilePrefix), "log"))
options(hiplotlib.script_dir = dirname(basedir))
run_hiplot()
# Step 5: plugin submission
Now you can submit your plugin via email (admin@hiplot.org) or GitHub https://github.com/hiplot/plugins-open (opens new window) by pull request.
# More examples
- ezcox (opens new window) - https://hiplot.cn/basic/ezcox (opens new window)
- pcatools (opens new window) - https://hiplot.cn/basic/pcatools (opens new window)
More information about UI design and setting can be found at https://hiplot.cn/docs/zh/development-guides/ (opens new window).
# Hiplot tag list
This part describes supported Hiplot tags.
@hiplot, 1 line, seperates the useful comments parsed by HiSub, onlystartandendare valid.@appname, 1 line, set your plugin name (cannot have space, it will be used to set the plugin URL on hiplot).@apptitle, 3 lines, set your plugin title.- The 2nd line set English title.
- The 3rd line set Chinese title.
@target: 1 line, where the target url should be deployed to, includesbasic,advance,clinical-tools, etc.@tag: 1 line, tags for your plugin, seperated by space.@author: 1 line, your name.@url: 1 line, your project link, like GitHub for your plugin (Optional).@citation: many lines, your reference or how to cite you (Optional).@version: 1 line, the version of this plugin.@release: 1 line, the release date of this version.@description: many lines, briefly describe the plugin.- For English, you should start the line with
en:. - For Chinese, you should start the line with
zh:.
- For English, you should start the line with
@main: 1 line, the main function to call for plotting.@library: 1 line, required packages for your plugin, so Hiplot team can check if they are installed.@param: many lines. From the 2nd line, it is same as@description. For the 1st line, it has the rules:<param_name> export::<param-type>::<widget-type>::<param_setting>- All
param_names are used to describe the parameters in the main function, here ishello world(). param-typecan be data (for data table), dataArg (for selecting column names in a data table), extra (custom parameters in your main function).widget-typecan be slider, switch, select, autocomplete, color-picker, text-field. More list and control see https://vuetifyjs.com/en/components/autocompletes/ (opens new window). You can see existing Hiplot plugin how to use config the widgets.param_setting(JSON format) depends on thewidget-type. In most common cases, adefaultitem is supported to set default value for the parameter, others items will be passed to front end for setting widget UI and behavior.
@return: 1line, it has the rules:<output-type>::<output-format>::<output-setting>output-typecan beggplot,plot(for plots not generated by ggplot) anddirectory(outputing a whole directory, you need read docs for more).output-format(JSON format) sets the figure output format like PDF, PNG, etc.output-setting(JSON format) corresponds to default general parameters in a plot which provided in Hiplot UI but cannot be mapped to parameters of the main functions, liketitle,palette,theme,widthandheightof the plot, etc. (cliModeis suggested enable, it works faster for simple plugin).
@data: many line, it contains code to generate example data described in data table parameters (Optional).
# Utils of Hiplotlib
Hiplotlib provides configuration variables and a lot of function families to execute the Hiplot plugin analysis worklfow and help to build a better plugin without writing too-many custom functions. You can directly use the features to custom output plots.
| Variable/function | Description |
|---|---|
| .conf | Mocked global objects to inherit web UI options/settings for plugin developer |
| .opt | Mocked global objects to inherit web UI options/settings for plugin developer |
| add_alpha | Add alpha to color |
| alter_fun | Prestored settings and functions related to ggplot2 or plots |
| brewer_palette_names | Prestored settings and functions related to ggplot2 or plots |
| brewer_pal_update | Prestored settings and functions related to ggplot2 or plots |
| capitalize | Capitalize a string |
| cb_palette | Prestored settings and functions related to ggplot2 or plots |
| choose_ggplot_theme | Prestored settings and functions related to ggplot2 or plots |
| colname2data | Reset 'colnames' of a data frame |
| col_fun_cont | Prestored settings and functions related to ggplot2 or plots |
| col_tag | Prestored settings and functions related to ggplot2 or plots |
| custom_color_filter | Prestored settings and functions related to ggplot2 or plots |
| data_arg_preprocess | Preprocess the data argument from conf object |
| deploy | Deploy Command Line Interface to System Local Path |
| draw_map | Prestored settings and functions related to ggplot2 or plots |
| export | Functions and utilities to export hiplot output |
| export_directory | Functions and utilities to export hiplot output |
| export_htmlwidget | Functions and utilities to export hiplot output |
| export_plotly | Functions and utilities to export hiplot output |
| export_pptx | Functions and utilities to export hiplot output |
| export_single | Functions and utilities to export hiplot output |
| get_hiplot_color | Prestored settings and functions related to ggplot2 or plots |
| ggplot2 | Prestored settings and functions related to ggplot2 or plots |
| ggplot2_themes | Prestored settings and functions related to ggplot2 or plots |
| ggplot2_themes2 | Prestored settings and functions related to ggplot2 or plots |
| ggsci_palette_length | Prestored settings and functions related to ggplot2 or plots |
| ggsci_palette_names | Prestored settings and functions related to ggplot2 or plots |
| gg_color_default | Prestored settings and functions related to ggplot2 or plots |
| globs | Functions to manage the global setting objects |
| globs_get | Functions to manage the global setting objects |
| globs_list | Functions to manage the global setting objects |
| globs_set | Functions to manage the global setting objects |
| graf_palette_names | Prestored settings and functions related to ggplot2 or plots |
| hiplotlib | hiplotlib package |
| html2pdf | Functions and utilities to export hiplot output |
| import | Functions and utilities related to data import |
| import_images_to_pdf | Functions and utilities to export hiplot output |
| list_same_string_position | Get the same characters in two strings |
| merge_pdfs | Functions and utilities to export hiplot output |
| mut_cols | Prestored settings and functions related to ggplot2 or plots |
| new_task_step | Functions and utilities related to hiplot task |
| parse_file_link | Functions and utilities to export hiplot output |
| pdf2image | Functions and utilities to export hiplot output |
| pdfs2image | Functions and utilities to export hiplot output |
| position_type | Prestored settings and functions related to ggplot2 or plots |
| prism_palette_names | Prestored settings and functions related to ggplot2 or plots |
| read_data | Functions and utilities to export hiplot output |
| return_ggplot_theme | Prestored settings and functions related to ggplot2 or plots |
| return_hiplot_palette | Prestored settings and functions related to ggplot2 or plots |
| return_hiplot_palette_color | Prestored settings and functions related to ggplot2 or plots |
| run_hiplot | Run hiplot |
| run_task_step | Functions and utilities related to hiplot task |
| set_complex_general_theme | Prestored settings and functions related to ggplot2 or plots |
| set_extra_pkgs | Set extra R packages before starting plugin |
| set_factors | Set a vector to a factor |
| set_general_pkgs | Set general R packages before starting plugin |
| set_global_confs | Check and update global setting before starting plugin |
| set_global_options | Set R global options before starting plugin |
| set_palette_theme | Prestored settings and functions related to ggplot2 or plots |
| split_pdfs | Functions and utilities to export hiplot output |
| system_safe | Run system commands |
| task | Functions and utilities related to hiplot task |
| transform | Transform value |
| transform_val | Transform value |
| transparentColor | Prestored settings and functions related to ggplot2 or plots |
| update_task_status | Functions and utilities related to hiplot task |
Updated at 2022/5/6
# Bug report | feature request
Please file an issue to https://github.com/hiplot/hiplotlib/issues (opens new window).
# Copyright
© 2020-2022 Hiplot team