8.17 Using Dates on an Axis
8.17.1 Problem
You want to use dates on an axis.
8.17.2 Solution
Map a column of class Date to the x- or y-axis. We’ll use the economics data set for this example:
economics
#> # A tibble: 574 x 6
#>   date         pce    pop psavert uempmed unemploy
#>   <date>     <dbl>  <dbl>   <dbl>   <dbl>    <dbl>
#> 1 1967-07-01  507. 198712    12.6     4.5     2944
#> 2 1967-08-01  510. 198911    12.6     4.7     2945
#> 3 1967-09-01  516. 199113    11.9     4.6     2958
#> 4 1967-10-01  512. 199311    12.9     4.9     3143
#> 5 1967-11-01  517. 199498    12.8     4.7     3066
#> 6 1967-12-01  525. 199657    11.8     4.8     3018
#> # … with 568 more rows
The column date is an object of class Date, and mapping it to x will produce the result shown in Figure 8.37:
ggplot(economics, aes(x = date, y = psavert)) +
  geom_line()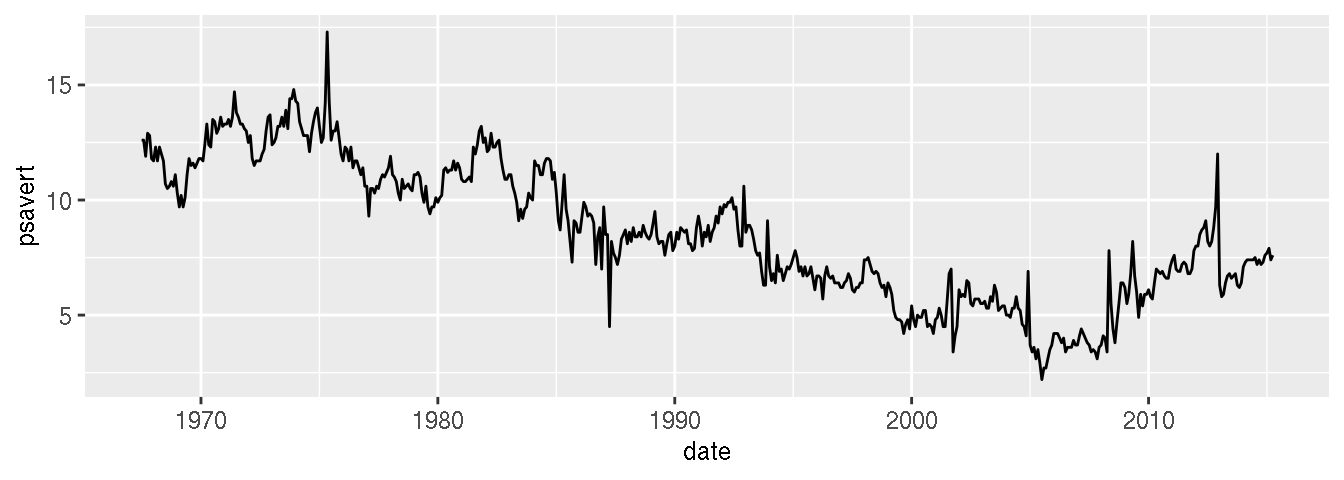
Figure 8.37: Dates on the x-axis
8.17.3 Discussion
ggplot handles two kinds of time-related objects: dates (objects of class Date) and date-times (objects of class POSIXt). The difference between these is that Date objects represent dates and have a resolution of one day, while POSIXt objects represent moments in time and have a resolution of a fraction of a second.
Specifying the breaks is similar to with a numeric axis – the main difference is in specifying the sequence of dates to use. We’ll use a subset of the economics data, ranging from mid-1992 to mid-1993. If breaks aren’t specified, they will be automatically selected, as shown in Figure 8.38 (top):
library(dplyr)

# Take a subset of economics
econ_mod <- economics %>%
  filter(date >= as.Date("1992-05-01") & date <  as.Date("1993-06-01"))

# Create the base plot, which does not specify the breaks
econ_plot <- ggplot(econ_mod, aes(x = date, y = psavert)) +
  geom_line()

econ_plot
The breaks can be created by using the seq() function with starting and ending dates, and an interval (Figure 8.38, bottom):
# Specify breaks as a Date vector
datebreaks <- seq(as.Date("1992-06-01"), as.Date("1993-06-01"), by = "2 month")

# Use breaks, and rotate text labels
econ_plot +
  scale_x_date(breaks = datebreaks) +
  theme(axis.text.x = element_text(angle = 30, hjust = 1))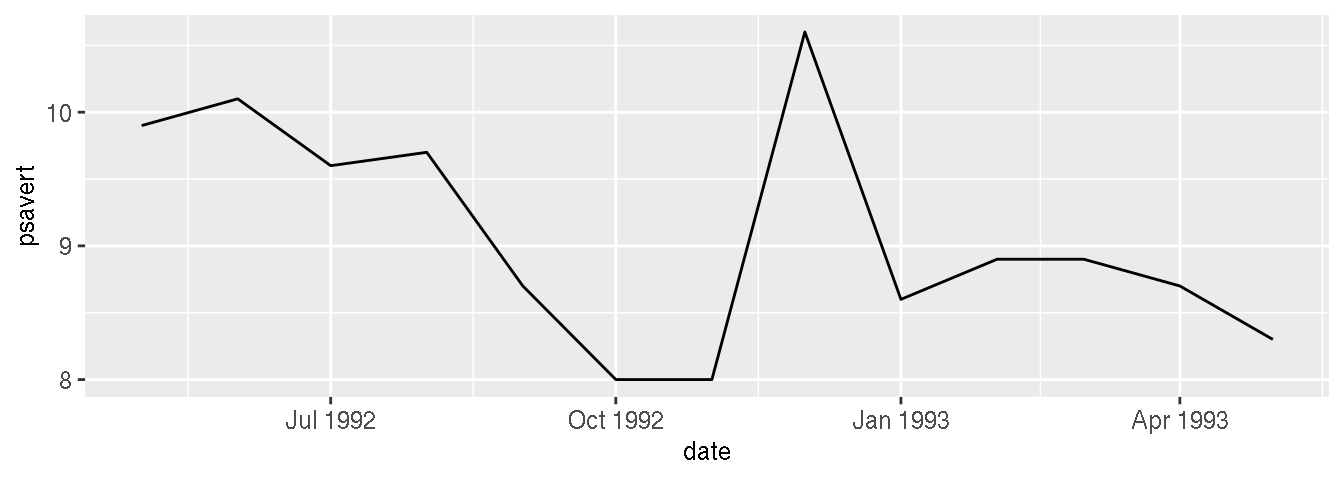
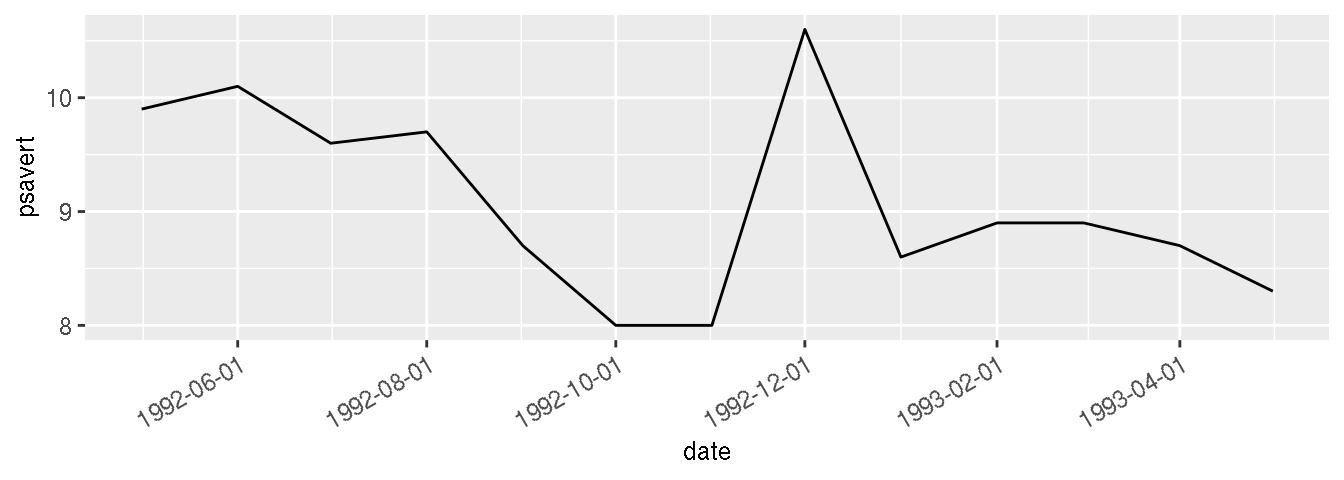
Figure 8.38: Top: with default breaks on the x-axis; bottom: with breaks specified
Notice that the formatting of the breaks changed. You can specify the formatting by using the date_format() function from the scales package. Here we’ll use "%Y %b", which results in a format like "1992 Jun", as shown in Figure 8.39:
library(scales)

econ_plot +
  scale_x_date(breaks = datebreaks, labels = date_format("%Y %b")) +
  theme(axis.text.x = element_text(angle = 30, hjust = 1))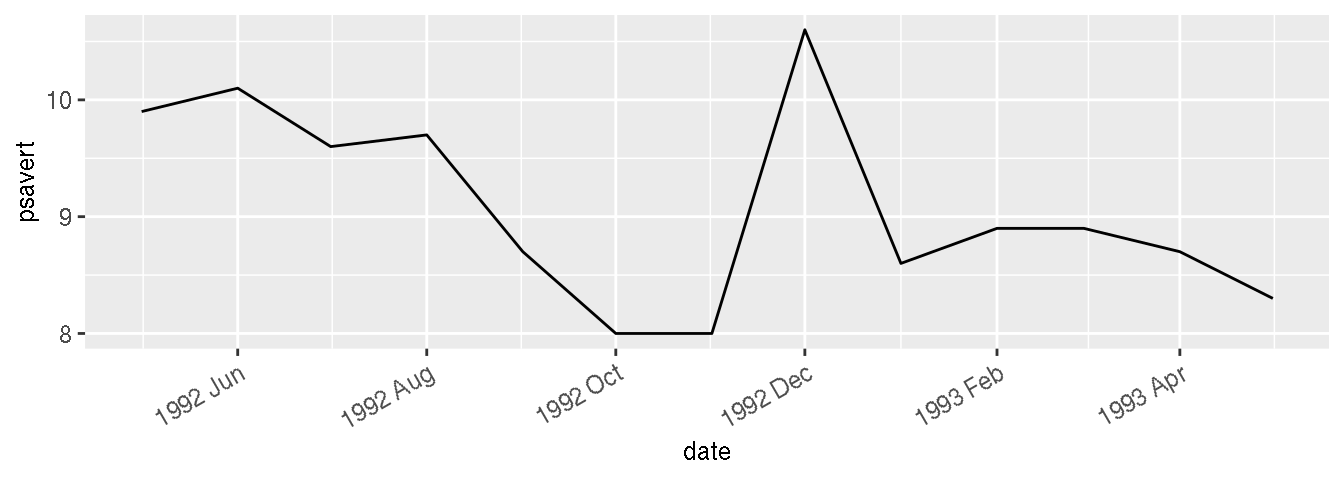
Figure 8.39: Line graph with date format specified
Common date format options are shown in Table 8.1. They are to be put in a string that is passed to date_format(), and the format specifiers will be replaced with the appropriate values. For example, if you use "%B %d, %Y", it will result in labels like “June 01, 1992”.
| Option | Description |
|---|---|
%Y |
Year with century (2012) |
%y |
Year without century (12) |
%m |
Month as a decimal number (08) |
%b |
Abbreviated month name in current locale (Aug) |
%B |
Full month name in current locale (August) |
%d |
Day of month as a decimal number (04) |
%U |
Week of the year as a decimal number, with Sunday as the first day of the week (00–53) |
%W |
Week of the year as a decimal number, with Monday as the first day of the week (00–53) |
%w |
Day of week (0–6, Sunday is 0) |
%a |
Abbreviated weekday name (Thu) |
%A |
Full weekday name (Thursday) |
Some of these items are specific to the computer’s locale. Months and days have different names in different languages (the examples here are generated with a US locale). You can change the locale with Sys.setlocale(). For example, this will change the date formatting to use an Italian locale:
# Mac and Linux
Sys.setlocale("LC_TIME", "it_IT.UTF-8")

# Windows
Sys.setlocale("LC_TIME", "italian")
Note that the locale names may differ between platforms, and your computer must have support for the locale installed at the operating system level.
8.17.4 See Also
See ?Sys.setlocale for more about setting the locale.
See ?strptime for information about converting strings to dates, and for information about formatting the date output.