14.8 Combining Several Plots into the Same Graphic
14.8.1 Problem
You want to combine several plots into one graphic output.
14.8.2 Solution
The patchwork package can be used to combine several ggplot2 plots into one graphic. (Figure 14.6).
library(patchwork)

plot1 <- ggplot(PlantGrowth, aes(x = weight)) +
  geom_histogram(bins = 12)

plot2 <- ggplot(PlantGrowth, aes(x = group, y = weight, group = group)) +
  geom_boxplot()

plot1 + plot2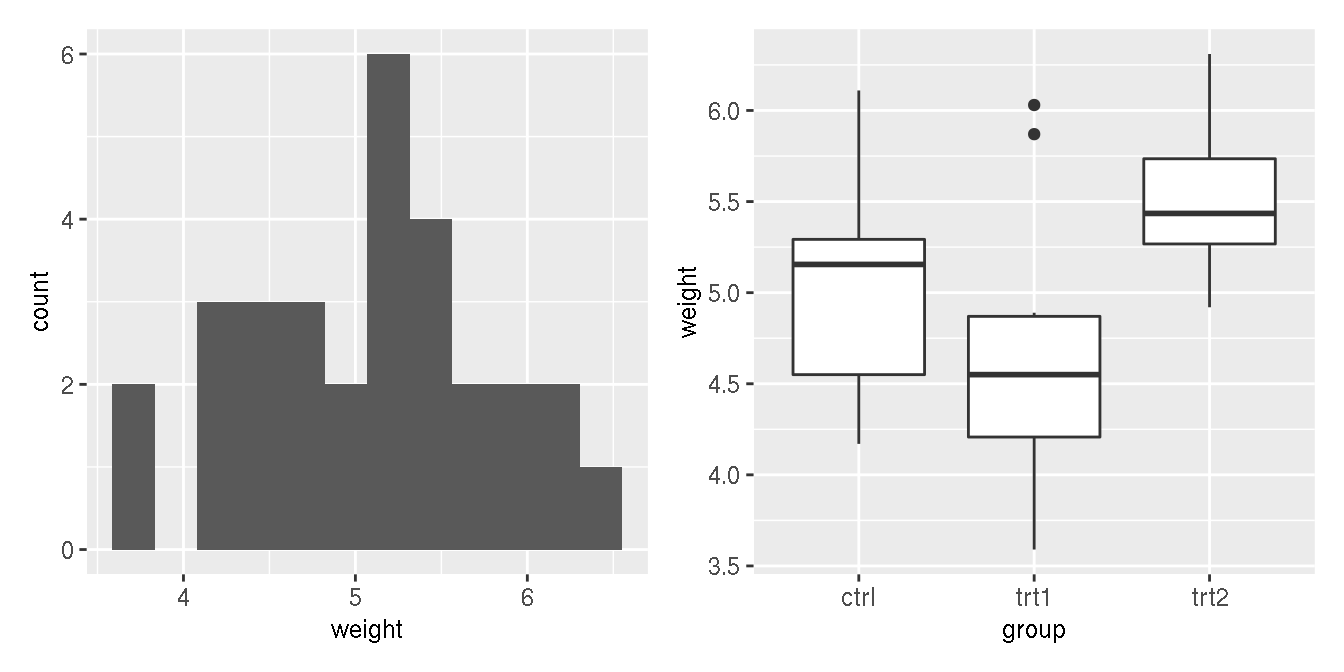
Figure 14.6: Combining two plots together using patchwork()
14.8.3 Discussion
Patchwork also allows you to determine how you want to lay out the ggplots in relation to each other, by adding a plot_layout() call. You can use this call to determine the number of columns you want the pplots to be arranged in (Figure 14.7), and the size of the plots (Figure 14.8):
plot3 <- ggplot(PlantGrowth, aes(x = weight, fill = group)) +
  geom_density(alpha = 0.25)

plot1 + plot2 + plot3 +
  plot_layout(ncol = 2)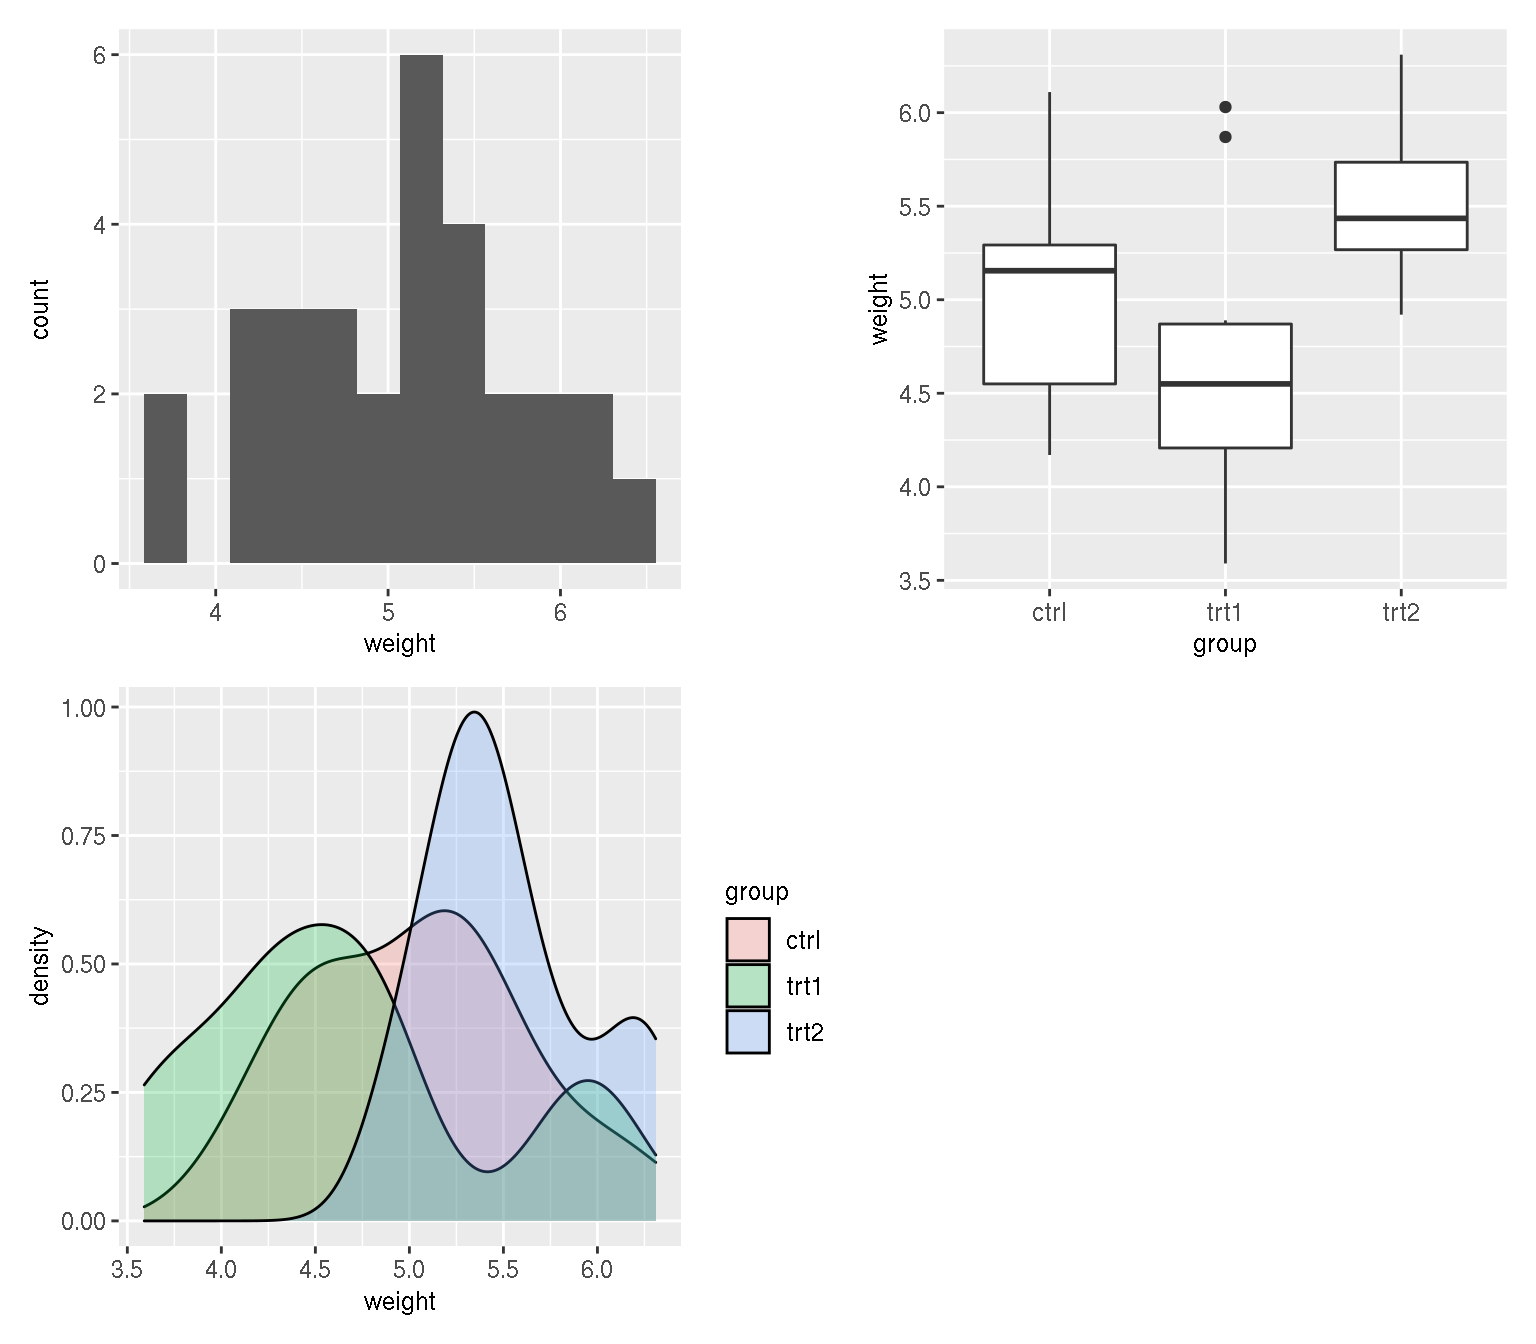
Figure 14.7: Using plot_layout() to specify that the plots should be arranged in 2 columns
plot1 + plot2 +
  plot_layout(ncol = 1, heights = c(1, 4))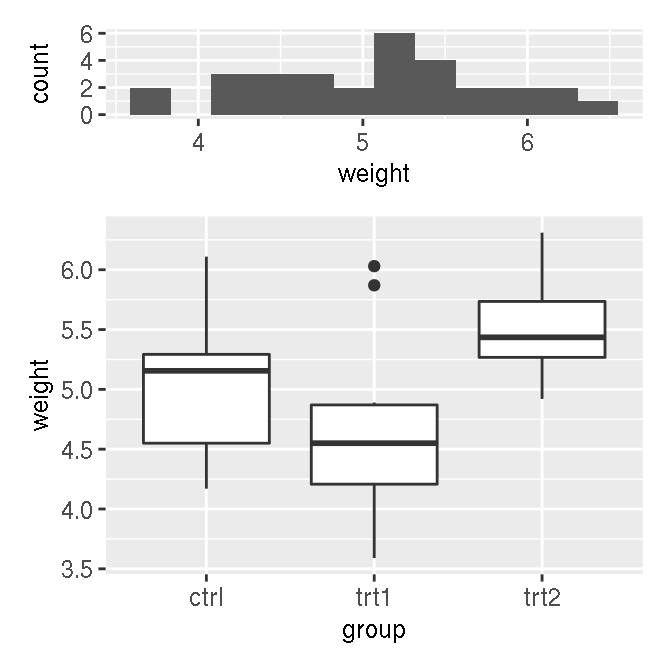
Figure 14.8: Using plot_layout() to specify the heights of each plot
In the future, patchwork may be available on CRAN, in which case it can be installed using the usual install.packages().
14.8.4 See Also
For more on additional patchwork features, see https://github.com/thomasp85/patchwork.